Analysis:
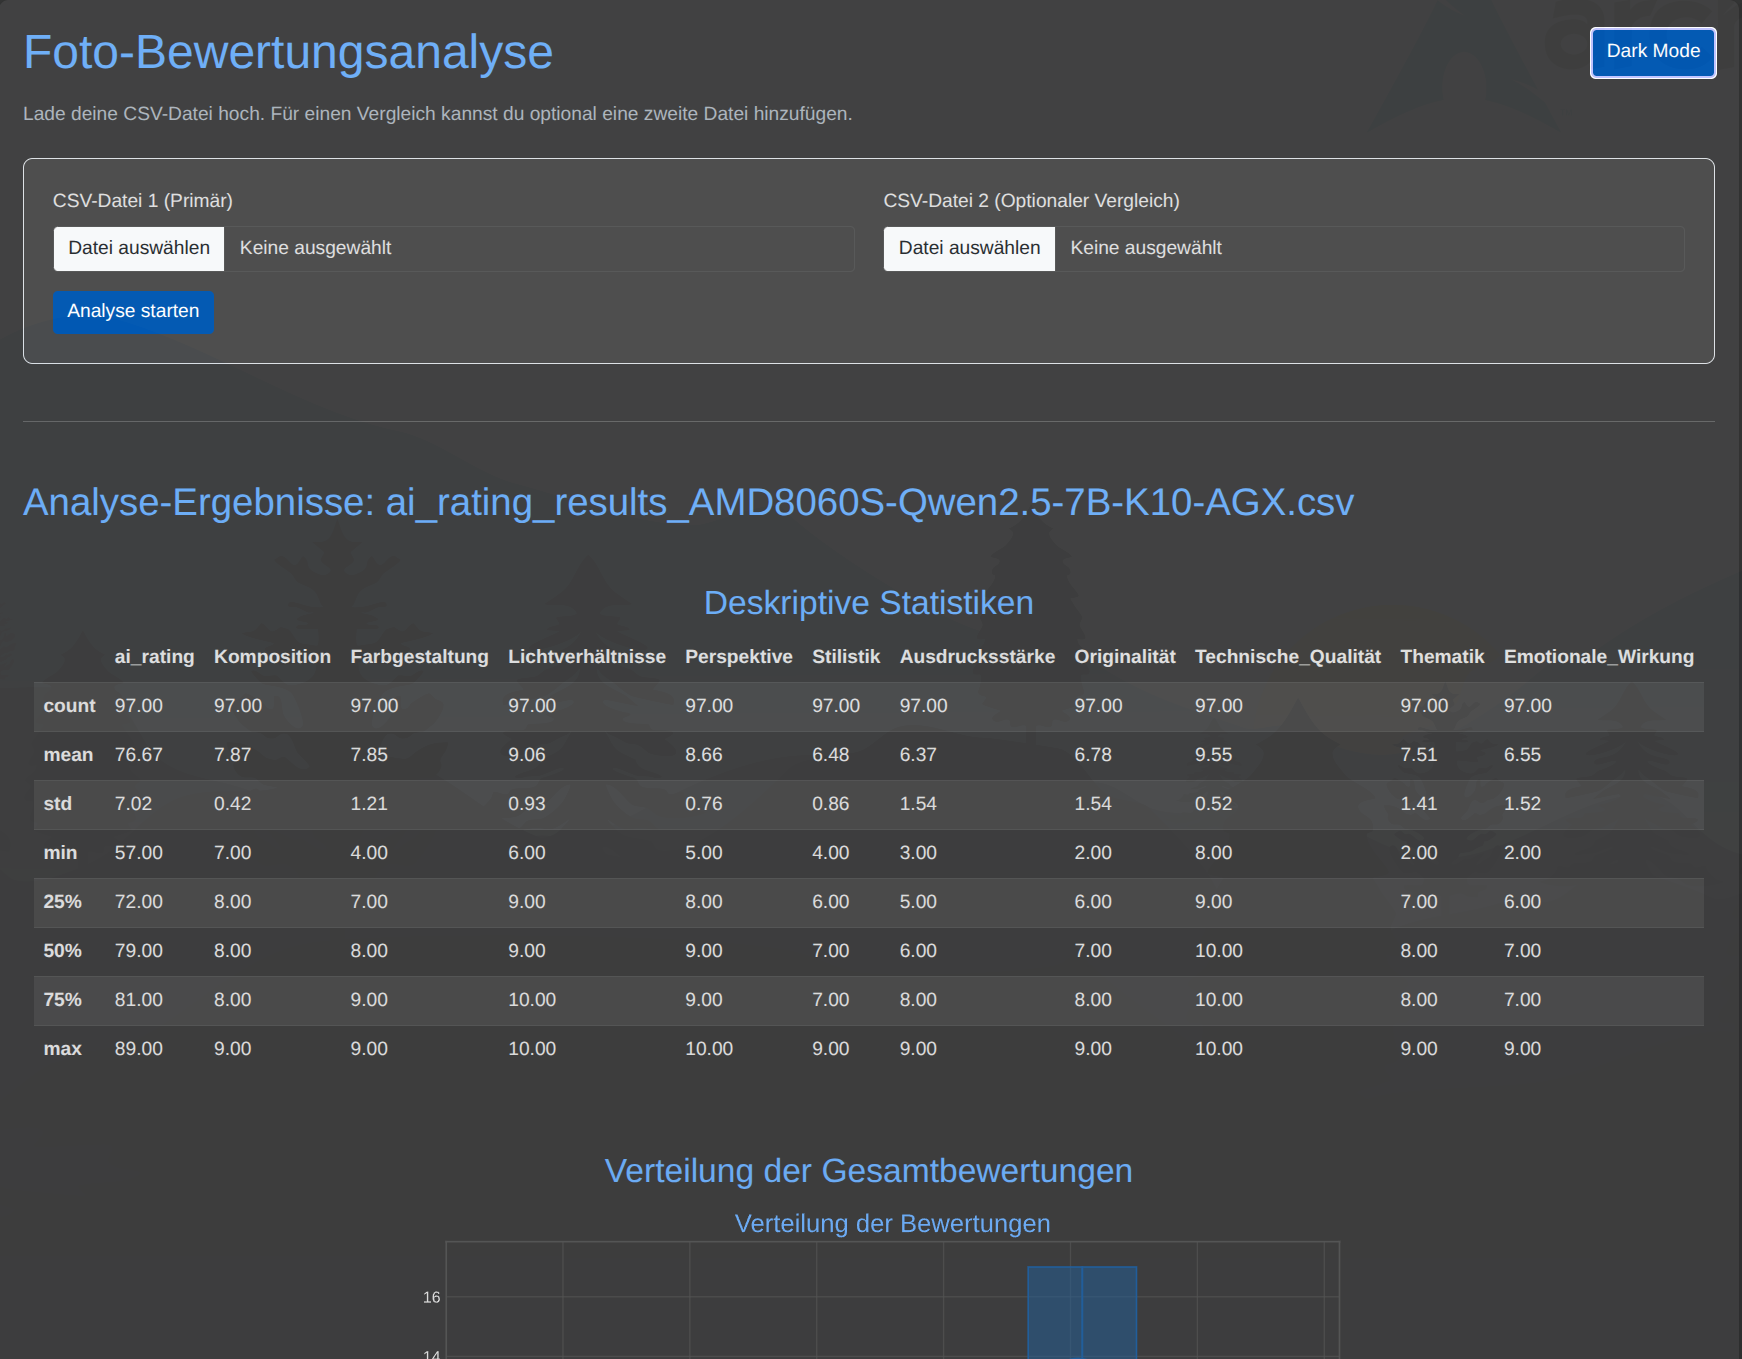
- Descriptive Statistics
- Distribution of overall ratings
- Correlation Heatmap
file download:
Unzip the file into your project folder.
Fish
# Wechsel in deinen Projektordner
cd python
# Aktiviere deine virtuelle Python-Umgebung (Arch Linux)
source .venvz/bin/activate.fish
# Installiere die nötigen Bibliotheken
pip install Flask pandas matplotlib seaborn
#Starte das Skript
python RatingAnalysisCSV.pyOpen in the browser: Open your web browser and go to the address http://127.0.0.1:5001.
Descriptive Statistics
| ai_rating | Composition | color design | lighting conditions | Perspective | Stylistics | expressiveness | Originality | technical_quality | Topic | emotional_effect | |
|---|---|---|---|---|---|---|---|---|---|---|---|
| count | 97.00 | 97.00 | 97.00 | 97.00 | 97.00 | 97.00 | 97.00 | 97.00 | 97.00 | 97.00 | 97.00 |
| mean | 76.67 | 7.87 | 7.85 | 9.06 | 8.66 | 6.48 | 6.37 | 6.78 | 9.55 | 7.51 | 6.55 |
| std | 7.02 | 0.42 | 1.21 | 0.93 | 0.76 | 0.86 | 1.54 | 1.54 | 0.52 | 1.41 | 1.52 |
| min | 57.00 | 7.00 | 4.00 | 6.00 | 5.00 | 4.00 | 3.00 | 2.00 | 8.00 | 2.00 | 2.00 |
| 25% | 72.00 | 8.00 | 7.00 | 9.00 | 8.00 | 6.00 | 5.00 | 6.00 | 9.00 | 7.00 | 6.00 |
| 50% | 79.00 | 8.00 | 8.00 | 9.00 | 9.00 | 7.00 | 6.00 | 7.00 | 10.00 | 8.00 | 7.00 |
| 75% | 81.00 | 8.00 | 9.00 | 10.00 | 9.00 | 7.00 | 8.00 | 8.00 | 10.00 | 8.00 | 7.00 |
| Max | 89.00 | 9.00 | 9.00 | 10.00 | 10.00 | 9.00 | 9.00 | 9.00 | 10.00 | 9.00 | 9.00 |
Distribution of overall ratings

Correlation Heatmap
